
Employer Success Program
Your Road Map to Business Success box
Pull out your experience mod history. Put your finger on the most recent number and look back one year. Did it move? Then find the Insurance Company History sheet. That one usually raises a question nobody has thought to ask at renewal.
Walk through your packet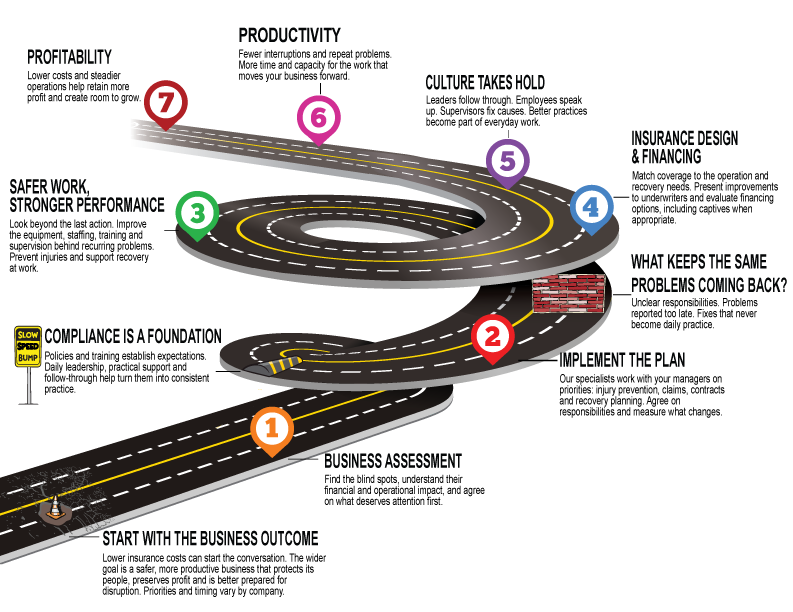
Start with your experience mod
Find the effective dates, then compare the last two entries on your history sheet. Did the number move?
The history says when. The rating worksheets behind each year say why, and that is a conversation rather than a sheet.
Worth knowing while you look: a claim keeps affecting your mod for three rating years, and the figure that counts is the one on file at a single valuation date, not what the claim finally closed for.
Now the sheet almost nobody asks about
Your insurance company history lists every policy going back several years. Policy number, the insurance company, its NAIC number, the dates.
Read down the company column.
If the name changes, and the NAIC number changes with it, those are two different insurance companies. They can sit inside the same group, and the name on your bill may not have changed at all. They are still separate insurers, and they do not have to charge the same rates for the same work.
Be clear about what the sheet proves, because it is narrower than it first looks. It shows the underwriting company changed. It does not show why, it does not show whether your rate went up or down, and it says nothing about what is available to you now.
Which is why it is a question rather than an accusation. If I were in your chair I would pull the policies for those two years, put the rates for the same class code side by side, and ask one thing.
What went into that placement, and what would you consider at our next renewal?
Did the underwriting company change? Bring the history sheet. We will work out what to ask before your next renewal.
Thirty minutes, no charge. Or pick a time on my calendar.
How you sit against others doing the same work
The comparison sheet lists other Pennsylvania employers carrying the same classification codes you do, with their mods beside yours.
Read it as a reference point rather than a verdict. Two companies can share a class code and run very different operations, so the list tells you the range that exists in your classification, not where you deserve to sit inside it. What it is good for is the question it raises. If employers doing your kind of work are carrying a lower number, what is different about the way their claims get handled?
If your packet includes a rate comparison
Not every packet has one. If yours does, find the two lines marked Your Current Rate Tier and Your Insurance Company's Best Rate Tier.
If those two numbers are different, your insurer lists a lower tier for the same class code. One question follows from that.
What would your insurance company need to see to consider you for that tier?
A listed tier is not an offer, and the gap by itself does not tell you why you sit where you sit. Placement turns on which company inside the group writes the account, your loss history, what the last inspection found, and the criteria that company applies. The sheet gives you the comparison. The answer comes from your insurer, and it is a fair thing to ask them.
Let's look at the figure that caught my eye
Bring the sheet from your box and the question it raised. We will go through the figure together, work out what we would need to check to explain it, and decide what is worth looking into before your next renewal.
Thirty minutes. There is no charge and nothing follows from it unless you want it to.
Rather pick a time now? Book 30 minutes on my calendar. It is on Teams.
What could this mean for your premium?
If your report included a premium illustration, it holds everything steady except the one figure we were looking at. Same payroll, same rates, same split across class codes. Only that one number moves.
That is deliberate, and it is the only way to see the weight of that single item. It also means the illustration is not a renewal quote and should not be read as one. A real renewal moves several things at once. Payroll changes, rates change, the mix of work shifts, and the insurer re-rates the whole account.
So read it as the size of one item against this year's numbers. Nothing beyond that.
And keep the two kinds of figures apart. The rates listed on your comparison are what your insurer publishes for that class code, and you can verify them. The premium figures are arithmetic built on assumptions, and they are only as good as what was held constant.
What do you measure before it shows up in your P&L?
There is a single sheet in your box for this. Look for Performance Management Scorecard under the Employer Success Program banner. Twenty questions, each rated one to ten, and it takes about five minutes.
Nobody scores a ten on all twenty, and a low score is not a judgment on anyone. Find your lowest one.
Then answer one question about it. What record would you need to pull, or what would you need to watch happen on the floor, to move that score up two points? Whatever that turns out to be, that is this month's work. Start there.
The reason this comes before the insurance conversation is simple. Everything on your loss runs already happened. The scorecard asks about the things that decide what lands on next year's.
If the paper copy has gone missing, here it is.
Want to go further? The five-minute workers' comp self-check scores your answers and gives you a report straight away. The paper exercise helps you pick one thing to check this month. The online one hands you a report.
Why you received the box
We work from public and licensed data on Pennsylvania employers. Certain patterns in that data tend to show up at companies carrying more employee related cost than their operation needs to carry. Your company showed one of them, so we pulled the detail on that one item, built the report that is in your box, and sent it to you.
Here is the honest limit on that. Data from outside a company can point at a question. It cannot answer it. The report tells you what is visible from here. What it actually means depends on things only the people inside your operation can see. That is why the next step is a conversation and not a proposal.
Why we do what we do
We started with one goal. Send employees home the same way they showed up to work. Chasing that goal led us to new ways of keeping people from getting hurt.
When an accounting firm compiled the results for clients who had been in the process at least two full years, it found 61% fewer employee injuries, 78% fewer lost-time injuries and 93% lower total injury costs.
The part we did not expect came from the clients themselves. They told us their turnover had dropped and their culture, performance and productivity had improved.
Clients have also saved more than $70 million since 2004 in premium reductions and recovered overcharges. That was never the goal. It came along with the rest of it.
What happened at other companies
Start with a conversation
Bring the sheet from your box and the question it raised. Tell me which figure your letter pointed to and I'll have looked at it before we talk.
Rather pick a time now? Book a 30-minute call on my calendar. It's on Teams.